
Introduction
Each year around 3 million scientifc papers are published, and it becomes more and more diffcult for clinicians to keep up-to-date with the scientifc literature of their specialty1. Indeed, a vast majority of articles may never be disseminated, cited or read, other than by the authors, the peer-reviewers and the editor of the accepting journal2. In order to improve the dissemination of research, journals and scientists have tried to apply new methods to share knowledge within the scientifc community, in an effective and effcient way. One such important innovation has been the introduction of the visual abstract (VA). In our digitalized world, it seemed obvious that the best mean to share VAs was to use social medias (SoMe). SoMe have remarkably changed how people communicate in the medical feld. They provided numerous modalities through which professionals have been able to present and exchange scientifc information through virtual communities and platforms3.
This review focuses on VAs, their structure and role within research dissemination, and summarizes their limitations and future directions need. In addition, a stepwise approach for preparing a good quality VA is suggested.
What is a visual abstract?
The frst VA was introduced in July of 2016 by Andrew Ibrahim, the Creative Director of Annals of Surgery, via social media using the hashtag #VisualAbstract4. Since then, numerous journals and institutions have adopted its use in their SoME strategy to disseminate scientifc research. A VA in an infographic style format, coupled with a shortened, limited word summary detailing the key question, methodology, fndings and take home message of the research study1. This process allows to transform scientifc information into an attractive graphic format that can be distributed promptly in SoMe, with the aim to allow rapid visualization, interpretation, and retention3. Such image-focused summaries provide scientists with a snapshot of current research fndings1. It has been shown that VAs improve memorability in comparison to verbal representation, and leads to the enhancement of cognition by means of visual thinking5. Furthermore, it may persuade the viewer to examine the research in greater depth by retrieving the full article, depending on research interests.
How to create a visual abstract?
There is variation in the layout and structure of VAs currently shared on SoMe. Guidelines to standardise VAs for scientifc research have been published and used regularly in the literature4. A majority of journals now provide their own guidelines to help standardise the design before submission. There are however some general concepts that can be recommended for the preparation of a good article. Table 1 summarizes the steps to follow in preparing VA, with some tips and tricks.
Visual abstract structure
Microsoft PowerPoint is the preferred tool to create VAs, and recommender by most journals, as it is the most widespread and easy to use tool. In order to have a VA that is easy to read and understand, it is essential to condense information and represent it logically and coherently into three main sections encompassing the methods, the main fndings and conclusions of the research study1. Most articles have many fndings or outcomes, but the VA should focus on the primary fndings of the article, between one to three. Short comparative sentences can be included, but numeric values should be provided for each of the fndings (values, units, statistical signifcance). The aim is also to allow readers to interpret the fndings themselves.
Not all scientists are artists, and complicated illustrative software or extensive graphics skills are not required. It only requires a minimum of creativity, with the help of co-authors, possibly more comfortable in representing results using visual icons. For ease of reading, the VA should have a clear start and end, preferably from left to right. The authors should try to reduce distracting elements and remove details as much as possible, and it is recommended to avoid including all of the study‘s fndings, while avoiding oversimplifcation at the same time. A rule of thumb is to prioritise the content included in the abstract of the main article, as this is what have deemed most important. It is also important that the fndings does not deviate from that contained in the original article. An example of a VA and a description of its different components is proposed in Fig. 1.
Research dissemination
VAs can be shared and widely disseminated using SoMe platforms such a Twitter, Facebook, LinkedIn and Research Gate. Most are accompanied by a link that provides access to a link to download the full article. Indeed, one study showed that the release of a research article in SoMe increased the number of people who view or download that article6. A survey showed that healthcare professionals had a preference for VAs rather than conventional written abstracts when communicating via SoMe, insofar as they allow for a quicker, more effcient read and that they were also more likely to facilitate long-term, factual retention1, 7. The effectiveness of a adding a VA as a research dissemination strategy has also been demonstrated in several studies. A frst prospective study found that there was a 8-fold increase in the number of retweets, and a 3-fold increase in the number of article visits when the article was tweeted with a VA compared with a title alone8. This was confrmed by other prospective studies, thus adding evidence that VAs have an impact in increasing the SoMe presence of an article, particularly through Twitter3, 9, 10.
Although VAs have become popular primarily through SoMe, its format can be adopted for other forms of research dissemination such as poster presentations at academic meetings and conferences. During the Swiss College of Surgeons (SCS) Annual Meeting 2023, VAs will make their appearance by means of printed poster, thereby permitting presenters to engage in interactive discussion with interested participants.
Limitations
It has been suggested that if research fndings are presented in a over simplifed manner in a VA, the outcomes could be potentially misleading with respect to the strength and signifcance of the study1. In addition, due to space limitations, authors may only focus on the positive fndings of the study and omit non-signifcant or negative results, thus introducing bias. It is important to note that the VA is not meant to replace the full-text article, but serves to generate reader interest. Indeed, because a good VA can provide an adequate summary of a study, readers may opt not to read the full article, thinking that the overview provided by the VA is suffcient3. Although tempting, especially when VAs are widely distributed, this systematic practice should be discouraged.
Anyone can create a VA, even a third party without scientifc dedicated knowledge. In these cases, the VAs may be more susceptible to inaccuracies, bias, or misrepresentation of the data being presented3. It is therefore absolutely essential to maintain a high level of quality control within the editorial teams of the journals which offer the possibility of disseminating a VA.
Table 1. Steps to create a visual abstract
1. Read your study and identify the following points
- Study design: retrospective, randomized controlled trial, case-control study
- Population: number of patients (N), key characteristics, inclusion/exclusion criteria
- Intervention or investigated condition, comparison
- Outcomes/Results (1-3 key points)
2. Prepare the visual abstract
- Use a program (easy to use: Microsoft Powerpoint).
- Some journals or conferences provide a basic VA template (check before you start),
but they may allow room for creativity and adaptation. - Divide the VA into sections: title, methods/population, outcomes/results, conclusions.
- Add the pertinent data for each of the sections, and avoid excessive detail (keep text to a minimum).
- Include the author citations and journal logo.
- Exclude trade names, logos, or images of trademarked items.
3. Visual Display
- Use one Font (Times/Arial/Calibri) and avoid underlining (can be confusing with hyperlinks).
- Choose the slide color scheme.
- One icon should be used to illustrate one key point.
- Icons used should be free of copyright restrictions (e. g. of free icons available:
https://pixabay.com, https://www.flaticon.com).
4. General rules
- The visual abstract should be a true reflection of the manuscript content and they should not be used to promote authors’ promotion which could impact on research groups’ credibility (1, 5).
- Ensure the reader is oriented and directed to follow the flow of information.
- Before submitting, share your visual abstract with your professional or private entourage to get feedback.
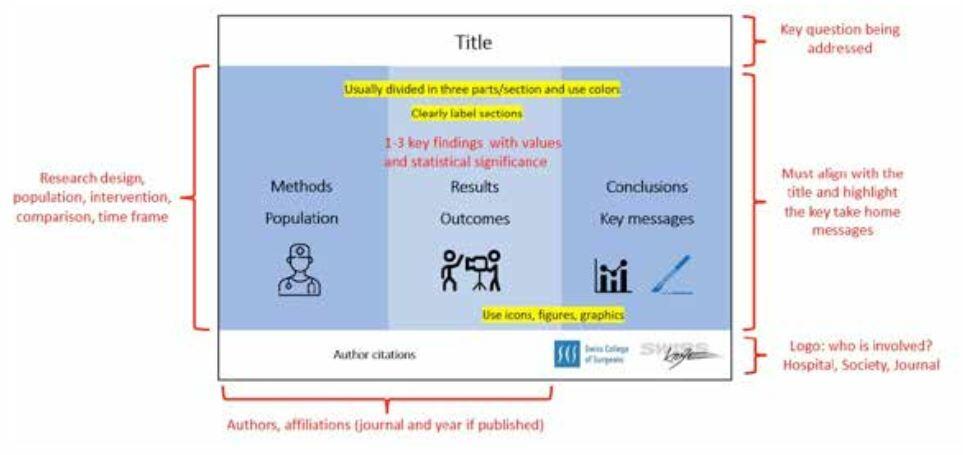
Figures 1. Visual abstract and its different components
Future prospects
The format of VAs continues to evolve, hence there is room for flexibility and innovation in their design1. Several journals now offer to submit a VA at the time of article submission, with the aim of distributing it within SoMe if the paper is accepted for publication. It is thus possible to combine article and VA in a more systematic way, but it remains to be seen whether it will replace the traditional 250-word abstract in the future. Furthermore, dedicated editors have been appointed to create or review the visual abstracts3.
Live VAs coupled with tweeting have also appeared at congresses to promote the main fndings and key messages from presentations to a wider audience4. This approach can encourage discussion online and enhance medical education. VAs can also be incorporated into speakers’ slide decks during live presentation. Another way to use Vas, and which did not seem to be a motivation for their creation initially, is its diffusion during a journal club, whether in person or virtually. They are used to draw attention to the article and the journal club by making it more playful and attractive3, 4, 11. Indeed, VAs may provide a quick summary to the participants who were unable to read the article before the meeting, and complex methodologies can be understood more easily.
An essential point that remains to be elucidated is who will create the VAs in the future. This can be the request of the authors, or be presented to them as an option when submitting an article.
Alternatively, a journal can form a team of VAs editors who can create visual abstracts for articles that have been accepted for publication, or improve VAs submitted by authors3. Regardless of
how a journal chooses to implement the use and dissemination of VAs, there must be opportunities for improvement, and feedbacks should be collected in order to make changes and maintain the
quality of published research.
Finally, because of the exponential number of VAs, it will be important to create repositories and dedicated websites to organize and collect them8. This would allow easier access, by surgical specialties and areas of interest for example.
Conclusions
Visual abstracts are innovative tools with high potential for knowledge dissemination in the scientifc community. It is however important to keep in mind that a VA is not a substitute for reading the full article and should not be used as the sole information for drawing fndings from research. Standardized guidelines for the creation and diffusion of VAs are needed to maintain scientifc rigor.
1. Millar BC, Lim M. The Role of Visual Abstracts in the Dissemination of Medical Research. Ulster Med J. 2022;91(2):67-78
2. Henriksen D MP. Innovations in the dissemination of action research: Rhetoric, media, and communication. CA M, editor: Medford: John Wiley & Sons; 2019
3. Ramos E, Concepcion BP. Visual Abstracts: Redesigning the Landscape of Research Dissemination. Semin Nephrol. 2020;40(3):291-7
4. Ibrahim AM. Seeing is Believing: Using Visual Abstracts to Disseminate Scientifc Research. Am J Gastroenterol. 2018;113(4):459-61
5. Nayak S, Iwasa JH. Preparing scientists for a visual future: Visualization is a powerful tool for research and communication but requires training and support. EMBO Rep. 2019;20(11):e49347
6. Allen HG, Stanton TR, Di Pietro F, Moseley GL. Social media release increases dissemination of original articles in the clinical pain sciences. PLoS One. 2013;8(7):e68914
7. Turck CJ SM, Tremblay SR, Sachse SL. Preliminary study of health care professionals’ preferences for infographics versus conventional abstracts for communicating the results of clinical research. J Contin Educ Health Prof. 2014;34(S1):S36-S8
8. Ibrahim AM, Lillemoe KD, Klingensmith ME, Dimick JB. Visual Abstracts to Disseminate Research on Social Media: A Prospective, Case-control Crossover Study. Ann Surg. 2017;266(6):e46-e8
9. Lindquist LA, Ramirez-Zohfeld V. Visual Abstracts to Disseminate Geriatrics Research Through Social Media. J Am Geriatr Soc. 2019;67(6): 1128-31
10. Koo K, Aro T, Pierorazio PM. Impact of Social Media Visual Abstracts on Research Engagement and Dissemination in Urology. J Urol. 2019;202(5):875-7
11. Colbert GB, Topf J, Jhaveri KD, Oates T, Rheault MN, Shah S, et al. The Social Media Revolution in Nephrology Education. Kidney Int Rep. 2018;3(3):519-29